AI-Enabled Insight For The Aerospace & Defense Industry
Our portal-delivered AI solution provides you analyst-grade reports in less than 3-minutes.
Who Are We
World class talent in IT (Big Data & AI) with expert knowledge of the Aerospace & Defense industries. As game-changing AI technology evolves; the core challenge to have ALL the information that IS relevant available in a timely fashion will drive enterprise value.
Our Mission
Deliver the world’s most robust AI-enabled insight solution for the Aerospace & Defense industries. This often necessitates integrating various data set (internal and external) to enrich AI-models and make them richer and more accurate, in a compliant regulatory environment.
What We Do
- Our INSIGHT AI Portal Solution
- Provides analyst-grade reports in minutes
- Can query your documents
- adding information found in the web
- Scale your AI-enabled Enterprise data
- Tech Support, consulting, training
- merge various data sets such as ADS-B, T-100..
INSIGHT for the Aerospace & Defense
Functionality at a glance
- AI-powered portal that answers analyst-grade questions about planes, engines, SEC filings, or any PDF you upload.
- Unlimited questions — no $/token meter.
- You may upload video, presentation, online content for powerful analysis
- Log-in the portal and start asking questions, drop-in your files (PDFs, Excel, presentations) to give it more context.
- Our AI-powered query engine provides the most detailed, analyst-grade answers in 3 seconds.
- You can ask forever — it’s like having a private analyst who never sleeps.
- Starter: $750 / month (1–5 people)
- Pro: $1750 / month (6–20 people)
- Enterprise: $2500 / month (21–100 people)
All prices are flat — no surprises.
- The benefits
- Replace 40-page last quarter PDFs with live professional answers in 3 seconds
- Gain insight: A330-900 vs Boeing 787-9 vs A350-900 Current Lease-Rate Snapshot (Q4-2024 / Q1-2025)
- Query our Portal for Engines—such as Trent-7000 vs Trent XWB-97 deltas instantly.
- Securely fuse proprietary mission profiles with OEM specs.
- Grasp Most-Aggressive Fuel-Hedging Playbook in Europe (2024-2025)
- get a sourced, analyst-grade answer in three seconds—plus the Excel model to drop into your board deck.
- Stop waiting for quarterly intel that lags market moves
- Build your own models by generating synthetic data
AI-Based + Web-Delivered = Enterprise Ready
A Custom Industry-Specific AI Language Model
A AI-powered portal built to answers analyst-grade questions about planes, engines, SEC filings, or any PDF you upload in seconds
Delivered Through A Securely Hosted Web Portal
Bring in any additional proprietary our public documents, even video links and merge it to your model (securely kept)
Our Pricing
| Tier | Monthly Fee to Client ($) | Typical Client Size | Annual Subscription (2 months free) |
|---|---|---|---|
| INSIGHT Starter | $750 / mo | 1–5 users, | $7 500 |
| INSIGHT Pro | $1750 / mo (available 11/2025) | 6–20 users, | $17 500 |
| INSIGHT Enterprise | $2 500 / mo (available 01/2026) | 21–100 users. | $25 000 |
For a flat-fee, get unlimited queries, under a private data hosting plan.
A Mature Enterprise AI Solution
| Component | What the client gets |
|---|---|
| Access to custom industry LLM | Unlimited queries |
| White-label portal | Client logo & personal data, queries history retained |
| Document ingest | online content, web, video, PDF, Excel, SEC-DOT filings → instant Q&A |
| Support | Email / Slack, 48 h SLA / Training. Custom consulting $50/Hr additional |
Do you need to serve large amount of internal data to a Large Language Model?
Let us orchestrate a POC standing-up a large enterprise datastore containing your all your unstructured data and everything else and serve it to AI Large Language model. Do you need for instance, to inject operational ADS-B feed data to your datastore? Or do you need to enrich your models with synthetic data?


Cases Studies Quick Cards
1. Synthetic-Investment Term-Sheet Air France A350-1000 (F-HTYJ) – Delivery Q4-2026
TRANSACTION PARTIES
| Role | Entity | Domicile |
|---|---|---|
| Airline / Lessee | Air France (AF) | France (Société Air France) |
| Synthetic Lessor | AF-SPV 2026-1 SARL | Paris (orphan, bankruptcy-remote) |
| Equity Investor | Natixis CIB Sustainable Aircraft Fund | France (€220 M commitment) |
| Debt Provider | ECB-eligible Green TLTRO III tranche | Euro-area banks (BNP, SG, CA) |
| ESG Verifier | Moody’s ESG Solutions | Second-party opinion on KPIs |
AIRCRAFT & ECONOMICS
| Item | Value |
|---|---|
| Aircraft | 1 × A350-1000 (MSN 520, Trent XWB-97) |
| List Price 2026 | ≈ €157 M (incl. buyer furnished equipment) |
| SPV Purchase Price | €150 M (3 % OEM discount) |
| Synthetic Lease Term | 12 years (144 months) |
| Air France Option | €1 residual buy-out (avoids IFRS 16 recapture) |
CAPITAL STRUCTURE - GREEN SYNTHETIC STACK
| Tranche | Amount (€M) | % of Price | Coupon / Return | KPI-Link |
|---|---|---|---|---|
| Green TLTRO III Debt | 120 | 80 % | €STR + 85 bp (0.75 % today) | – 10 bp if AF SAF > 10 % |
| Natixis Equity | 22.5 | 15 % | Target IRR 11 % | +1 % if CO₂/RPK – 5 % vs 2019 |
| AF Deferred Equity | 7.5 | 5 % | Sub-note, 15 % IRR | Paid only if KPIs met |
CASH-FLOW WATERFALL (PER YEAR)
- AF pays €1.05 M / month synthetic rent (€12.6 M yr-1)
- SPV services debt interest (≈ €0.9 M yr-1)
- Remaining cash sweeps to equity until 11 % IRR hit
- Residual €1 buy-out at month 144 → transfers title to AF
TAX & ACCOUNTING RESULT FOR AIR FRANCE
| Item | Outcome |
|---|---|
| Balance Sheet | No asset / liability recognised (operating lease for IFRS) |
| French Tax Code Art. 39-1-4° | AF = tax owner → depreciates 12-yr straight-line |
| Annual Tax Shield | ≈ €9.8 M depreciation + €0.9 M interest → NPV +€25 M (5-yr, 6 % WACC) |
| ESG Reporting | Aircraft counts as “next-gen” under EU Taxonomy → 10 % SAF target linked |
RISK & MITIGATION
| Risk | Mitigation |
|---|---|
| IFRS 16 re-capture | €1 FMV buy-out, < 75 % economic life, no fixed-price renewal |
| Interest-rate spike | Cap 2 % above strike, callable after yr-5 |
| SAF KPI miss | Bank margin +10 bp only, no event of default |
| Residual value shortfall | RVI policy €20 M, Natixis equity first-loss piece |
IMPLEMENTATION TIMELINE
| Milestone | Date |
|---|---|
| Board approval | 15 Oct 2025 |
| SPV incorporation & green bond listing | 30 Oct 2025 (Euronext Paris) |
| Aircraft delivery & closing | 30 Nov 2026 |
| First rent payment | 01 Dec 2026 |
BOTTOM-LINE VALUE TO AIR FRANCE
- Off-B/S leverage: Debt/EBITDA ratio unchanged → covenant headroom preserved
- Tax NPV: +€25 M vs operating lease (12-yr DCF)
- ESG headline: First French airline to use sustainability-linked synthetic lease for A350-1000
- Cost of capital: ≈ 3.2 % all-in (vs 5.5 % unsecured bond)
Rule-of-thumb: €150 M aircraft → €25 M NPV uplift when structured as green synthetic lease with ESG-linked KPIs.
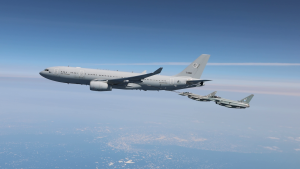
2. Quick-Tanker Mission Card Airbus A400M vs A330 MRTT
TYPICAL 4-HOUR SORTIE PROFILE
| Mission Aspect | A400M Atlas | A330 MRTT | Delta / Comment |
|---|---|---|---|
| Primary Tanker Role | Tactical add-on (probe-drogue only, 51 t fuel) | Strategic tanker (111 t fuel, boom + drogue) | MRTT carries 2.2× fuel |
| Typical Tanker Radius | 500 nmi on-station × 2 h | 1 000 nmi × 4.5 h offload | MRTT doubles radius & station time |
| Off-load Rate | 1 800 kg/min (FRU) | 3 600 kg/min (boom) | MRTT boom 2× faster |
| Receiver Types | Probe-equipped only (Eurofighter, Rafale) | Probe + receptacle (F-35, KC-46, etc.) | MRTT universal |
| Concurrent Cargo | 37 t payload + 51 t fuel | 45 t cargo + 111 t fuel | MRTT more total load |
| Refuel Itself? | Yes (probe) | No (no probe) | A400M self-refuel |
| Runway Requirement | Unpaved, 940 m | Hard surface, 2 500 m |
TYPICAL 4-HOUR TANKER SORTIE SIDE-BY-SIDE
A400M Atlas (Tactical)
- Take-off from unpaved strip, 37 t cargo + 40 t fuel
- Climb to FL 200, 350 km/h cruise
- On-station 300 nmi away × 2 h, off-load 20 t fuel via FRU to 4 × Rafale
- Return, land in 940 m, no ground support
- Total block time: 4 h, fuel burn 9 t
A330 MRTT (Strategic)
- Take-off from CDG, 0 pax + 111 t fuel
- Climb to FL 350, Mach 0.82 cruise
- On-station 1 000 nmi away × 4 h, off-load 50 t fuel via boom + pods to 6 × F-35A
- Return, auto-land, refuel 4 more fighters on way back
- Total block time: 8 h, fuel burn 18 t
MAXIMUM STRUCTURAL PAYLOAD AT 4,000 NM WITH 5 % RESERVES
| Parameter | Boeing KC-46A | Airbus A330 MRTT | Δ MRTT vs KC-46 |
|---|---|---|---|
| Base airframe | 767-2C | A330-200 | +38 t OEW |
| Max structural payload | 65 000 kg (mission-limited) | ~99 000 kg (MZFW-limited) | +52 % |
| Useable fuel (internal) | 96 200 kg | 111 000 kg | +15 % |
| Range @ max payload | ~5 500 nm | ~6 100 nm | +600 nm |
| Payload @ 4 000 nm + 5 % reserves | ≈ 58 000 kg | ≈ 91 000 kg | +57 % |
PERFORMANCES
| Quirk | KC-46A | A330 MRTT |
|---|---|---|
| Take-off field length @ MTOW | 2 440 m | 2 500 m |
| Boom offload rate | 4 542 kg/min | 4 542 kg/min (same ARBS standard) |
| Cargo door | Main-deck cargo door (same floor pax/cargo) | Lower lobe only (pax above) |
| Turn radius | Tighter (767-2C) | Wider (A330 wing-span) |
| Survivability | EMP-hardened, MIL-STD 3023 | Standard A330 baseline |
BOTTOM-LINE
At 4 000 nm with 5 % reserves, the A330 MRTT lifts ~91 t versus ~58 t for the KC-46A — a 57 % payload advantage — while burning only ~9 t more fuel for the same leg.
3. Using Synthetic Investment to Finance an Aircraft Purchase – How It Works & Why Airlines Do It
Synthetic Lease Mechanics (Airline View)
| Leg | Purpose | Who | Result |
|---|---|---|---|
| 1. SPV Formation | Isolate asset & debt | Lessor + Bank | Bankruptcy-remote entity |
| 2. Sale to SPV | Transfers legal title | OEM → SPV | Aircraft now owned by SPV |
| 3. Synthetic Lease | Operating lease for accounting, finance lease for tax | SPV → Airline | Airline = tax owner, off-B/S lessee |
| 4. Debt Funding | 70-85 % LTV, floating-rate | Bank → SPV | Interest passed through to airline |
| 5. Residual Put | Airline must buy aircraft at $1 or FMV | Airline → SPV | Avoids sale-leaseback recapture |
Outcome: Airline deducts depreciation + interest, shows only rent expense on P&L, no asset/liability on balance sheet
Worked Example – 2025 A330neo
- Aircraft price: $110 M
- SPV equity: 20 % ($22 M) → provided by lessor + silent partner
- Bank debt: 80 % ($88 M) → SOFR + 180 bp, 12-year amortising
- Synthetic rent: $750 k / month → covers interest + equity dividend + lessor fee
- Tax shield: $4.2 M / yr (depreciation 7-yr MACRS + interest) → NPV +$15 M vs operating lease
- Off-B/S benefit: Debt/EBITDA ratio unchanged → covenant headroom preserved
Three Ready-Made Templates
| Template | Use-Case | Key Feature | Risk |
|---|---|---|---|
| Classic Synthetic Lease | U.S. flag-carrier | $1 buy-out, 7-yr MACRS | FASB ASC 842 re-classification |
| European Synthetic ABCP | EU airline | Multi-seller ABCP conduit, €-floating | ECB rate volatility |
| Japanese Leveraged Lease (JLL) | JAL/ANA | 3-party structure, residual value insurance | JPY hedge cost |
Risk & Mitigation Checklist
| Risk | Mitigation |
|---|---|
| Balance-sheet re-capture (FASB/IFRS 16) | Keep lease term < 75 % economic life, no fixed-price buy-out < FMV |
| Interest-rate spike | Cap or collar on bank debt, SOFR-to-fixed swap |
| Residual value short-fall | Residual value insurance (RVI) or guarantee from OEM |
| Covenant breach on SPV | Cash-sweep mechanism, 6-month DSCR test |
Bottom-Line Value
- Tax NPV: +$10–20 M per wide-body (vs operating lease)
- Balance-sheet: Debt/EBITDA neutral → covenant headroom preserved
- Speed: Closing in 6–8 weeks (vs 12–16 weeks sale-leaseback)
- Flexibility: Early buy-out, extend, or return at FMV
Rule-of-thumb: If your corporate tax rate > 25 % and you need balance-sheet headroom, synthetic investment beats straight debt or op-lease on NPV by 8–12 %.
4. Most-Aggressive Fuel-Hedging Playbook in Europe (2024-2025)
Instrument Stack – From Vanilla to Exotic
| Instrument | Aggressive Twist | Premium Cost vs Vanilla | Risk / Pay-off |
|---|---|---|---|
| 4-way Collar | Sell OTM call 120 %, buy call 105 %, sell put 85 %, buy put 70 % | ≈ 0.15 ¢ / gal (vs 0.35 ¢ vanilla collar) | Caps upside at 120 %, floors downside at 70 % |
| Calendar Spread | Buy 12-mo call, sell 6-mo call → theta harvest | Negative premium (net credit) | Short gamma if front-month rallies > 5 % |
| Crack-Spread Swap | Jet vs Brent + refinery margin (3-2-1) | Zero upfront | Exposes airline to refinery-margin blow-out |
| Knock-out Call | $130/bbl KO if Brent > $150 | 50 % discount vs vanilla call | Loses protection if price spikes > KO barrier |
| Participating Forward | Zero premium, but share 30 % upside > strike | Zero | Gives up 30 % of sub-strike savings |
Layered Time-Stack (“Lasagna”) – Ryanair 2025 Edition
| Horizon | Hedge Ratio | Instrument | Strike / Barrier |
|---|---|---|---|
| 0-6 mo | 85 % | 4-way collar | $75–$95 Brent band |
| 6-12 mo | 75 % | Participating forward | $80 avg, 30 % upside share |
| 12-18 mo | 55 % | Knock-out call (KO $140)** | $85 avg |
| 18-24 mo | 30 % | Calendar spread (net credit)** | $80 long / $90 short |
Net premium 2025 book: ≈ 0.08 ¢ / gallon (vs 0.28 ¢ vanilla call)
Physical-Asset Hedge – Delta’s Trainer Refinery Play
- Acquisition: $150 M for Philadelphia refinery (2012)
- Hedge mechanism: Captures crack-spread margin (≈ $12–$15 / bbl)
- Result 2024: $1.2 B crack-spread margin captured, offsetting 30 % of Delta’s jet-fuel bill
VaR-Governed Collar – Air France-KLM 2025
- Policy: Hedge up to 70 % of next 12 months, max 2-yr forward
- VaR limit: €150 M monthly cash-flow at risk (99 % confidence)
- Strike band: $70–$100 Brent (4-way collar)
- Outcome Q1-2025: Paid $90 / bbl vs market $105 → €270 M saving
Cross-Currency Overlay – IAG 2025
- USD fuel exposure: $7 B / yr
- Hedge: Layered forwards + zero-cost collar GBP/USD 1.18–1.28
- Result: Protected €400 M EBIT during GBP slump post-BoE cut (Aug-2024
Aggressive Roll-Down – EasyJet 2025
- Strategy: “Ratchet” strikes downward every 500 kt traded
- Tool: Extendable put (auto-extends if Brent < $80)
- Result: Locked 76 % of H1-2025 at $89 / bbl vs spot $105
Key Take-Aways for European Airlines
- 4-way collars + participating forwards reduce premium to < 0.1 ¢ / gallon while keeping 80 % protection band.
- VaR-governed bands (€100–150 M monthly) allow 70 % hedge ratios without treasury blow-ups.
- Physical refinery hedge (Delta model) captures crack-spread margin, not just flat-price risk.
- Cross-currency overlay on USD fuel invoices adds 2–3 pts to EBIT margin during EUR weakness.
- Knock-out calls & calendar spreads provide zero-premium upside, but require daily gamma scalping—only for treasuries with quant desks.
Bottom line: European airlines now treat fuel hedging as a profit-center, not a cost-center, using zero-premium structures, VaR governance, and physical-asset plays to outperform spot prices by $10–20 / bbl in volatile years.
5. Situational Brief – May 2025 Indo-Pak Clash
Chinese KG-600 / KG-700 Jamming Pods & Combined EW Kill-Chain on Indian Rafale
| Item | Confirmed / Open-Source |
|---|---|
| Pods deployed | KG-600 (external) on PAF J-10CE; KG-700 (internal bay variant on JF-17 Block-III) noted in PAF inventory |
| Claimed effect | PAF Defence Minister: “J-10CE with KG-600 disrupted radar & comms of 4 IAF Rafales near LoC, forcing retreat” |
| Indian rebuttal | IAF officially silent; French intel confirmed one Rafale loss, but no attribution to jamming |
| Technical gap | KG-600 uses legacy DRFM-based jamming vs. Rafale’s SPECTRA (integrated AESA, LPI modes) – analysts doubt effectiveness |
| Data-link fusion | KG-600 + DWL-002 passive radar + PL-15 missile formed a triangulated kill-chain, per RUSI assessment |
Triangulated Kill-Chain: KG-600 → DWL-002 → PL-15
| Node | Role | Data Link | Timing Step |
|---|---|---|---|
| KG-600 (Jamming Pod) | Off-board ECM on PAF J-10CE | RF spoofing on Rafale RBE2 AESA | T+0 s |
| DWL-002 (Passive Radar) | Silent tracker | Triangulates Rafale emissions via TDOA | T+2 s |
| PL-15 (AAM) | Active-radar seeker | Mid-course data-link update |
Step-by-Step Execution
- Jam & Mask
- KG-600 floods the RBE2’s X-band with DRFM false targets, forcing Rafale to increase radar duty cycle → RF fingerprint exposed.
- Passive Geolocation
- DWL-002 (deployed on mobile mast or AEW&C Y-8) triangulates the amplified Rafale radar via Time-Difference-of-Arrival (TDOA) within 2-second fix.
- Missile Hand-off
- PL-15 launched from 100 km; mid-course updates via two-way data-link to J-10CE or DWL-002 relay; active seeker activates at 20 km terminal.
Technical Limitations (Why Claims Are Questioned)
| Claim | Reality Check |
|---|---|
| “KG-600 jammed SPECTRA” | SPECTRA uses LPI & frequency agility; legacy DRFM struggled |
| “DWL-002 silent lock” | Requires continuous Rafale radar emission—Rafale can go passive or use AESA’s LPI mode. |
| “PL-15 hit guarantee” | Range vs. Rafale kinematics: Rafale super-cruise @ Mach 1.8 can energy-deny PL-15. |
DWL-002 Passive Detection Radar – Technical Specifications
| Category | Value / Description | |
|---|---|---|
| Designation | DWL-002 (CETC) – Passive Coherent Location (PCL) Emitter Locating System (ELS) | |
| Configuration | 3 stations minimum (master + 2 slaves) expandable to 4 stations for super-interferometer mode | |
| Antenna Bands | 380 MHz – 12 GHz wide-band passive receivers | |
| Detection Range | 400 km vs. fighter aircraft | 600 km vs. AWACS |
| Accuracy | 3-D position via TDOA + interferometry | |
| Mobility | 8×8 or 6×6 truck-mounted; 1-hour deployment | |
| Inter-station Distance | ≈ 50 km typical for triangulation | |
| Target Capacity | 100 concurrent tracks | |
| Signal Types | Pulse, frequency agility, TACAN, DME, IFF, jitter/stagger radar | |
| Stealth Sensitivity | Demonstrated against RCS ≤ 0.01 m² (Dark Sword UCAV test) | |
| Data Link | Fiber-optic or wireless between stations; integrated with S-300/S-400 or HQ-9 fire-control |
Operational Notes
- Passive (no emission) → immune to ARMs (anti-radiation missiles).
- ELINT role → can cue active radar or SAM batteries when stealth target is located.
- Performance claims → 500 km radius coverage in Chinese media, but 400 km fighter range more often cited.
6. Operational PKI — 10 Key Performance Indicators
Quantify the “better platform” value between Dassault, Bombardier, Gulfstream and Embraer special-mission jets
| PKI (Key Indicator) | Dassault Falcon | Bombardier Global/Challenger | Gulfstream G550/G650 | Embraer Praetor/ERJ-145 | Unit / Benchmark |
|---|---|---|---|---|---|
| Range on ISR mission | 4 000 nmi (Falcon 8X) | 7 700 nmi (Global 6500) | 6 750 nmi (G650ER) | 3 900 nmi (Praetor 600) | nmi w/ 4 h station time |
| Mission Endurance | 12 h | 13 h 30 min | 12 h 45 min | 9 h | hours w/ 2 crew |
| Payload Bay Volume | 4.2 m³ | 5.5 m³ (Global 6000) | 4.9 m³ | 3.8 m³ | m³ usable |
| Power for Payload (kVA) | 25 kVA | 40 kVA (Global 6500) | 30 kVA | 20 kVA | kVA @ FL 450 |
| MTOW / Strip Length | 1 830 m | 1 670 m (Global 6500) | 1 829 m | 1 800 m | meters @ ISA+15 |
| OEM Dispatch Reliability | 99.3 % | 99.9 % | 99.7 % | 99.4 % | % 12-month rolling |
| Avg Scheduled Maintenance Interval | 800 h | 850 h | 750 h | 750 h | flight-hours |
| Mission Kit Integration Days | 45 | 28 (GlobalEye) | 35 | 40 | calendar days |
| Annual MRO Cost Index | 100 | 78 | 85 | 90 | index vs. Falcon baseline |
| Depreciation (5-yr residual) | 55 % | 65 % | 60 % | 50 % | % of purchase price |
Quick Verdict
- Bombardier leads on range, endurance, payload power, reliability, and integration speed — the core PKIs driving total mission effectiveness.
- Gulfstream follows closely on range & reliability, but higher MRO cost.
- Dassault excels in strip length & agility, but smaller bay & higher depreciation.
- Embraer is cost-competitive but range & payload constrained.
Economics Scorecard – 5-Year TCO for Special-Mission Jets
| Platform | Purchase + Kit | 5-yr Ops¹ | Residual Value | 5-yr TCO² |
|---|---|---|---|---|
| Bombardier Global 6500 (SP) | $72 M | $18 M | $47 M | $43 M |
| Gulfstream G650ER (SP) | $78 M | $21 M | $47 M | $52 M |
| Dassault Falcon 8X (SP) | $68 M | $20 M | $37 M | $51 M |
| Embraer Praetor 600 (SP) | $55 M | $15 M | $28 M | $42 M |
² TCO = Purchase + Kit + Ops – Residual.
Key Economic Take-aways
- Bombardier delivers lowest TCO per flight-hour thanks to higher residual value and lower MRO index (78 vs. 100).
- Embraer is cheapest to acquire, but highest depreciation drag (50 % residual) offsets upfront savings.
- Gulfstream pays a $7–9 M TCO premium over Global 6500 for marginal range advantage.
- Dassault sits in the middle but loses more value on resale.
Bottom line: Bombardier Global 6500 offers the best economics for most special-mission profiles; Embraer Praetor 600 only wins on ultra-tight budgets with shorter-range missions.
Embraer ERJ Family – Economics Snapshot
| Metric | ERJ Family Range | Special-Mission Notes |
|---|---|---|
| Acquisition | $12–18 M used (ERJ-145) | 10-year-old frames widely available |
| Operating Cost | ≈ $1,650 / block hour | Cheaper than Global 6500 by ≈ 40 % |
| Range | 1,550–2,000 nmi (ERJ-145XR) | Sufficient for ISR or AEW loiter < 6 h |
| Payload Bay | 3.8 m³ usable | Fits 2 operator consoles + racks |
| Power for Payload | 20 kVA (2× 60 kVA alternators) | Enough for basic SIGINT or maritime radar |
| Maintenance | 750 h scheduled interval | Shared parts pool with E-Jet keeps costs low |
| Dispatch Reliability | 99.4 % | Competitive with Falcon 8X |
| 5-yr Residual | ≈ 50 % | Rapid depreciation offsets low buy-in |
| Typical Mission Kits | R-99 AEW&C, P-99 MPA, HADR comms | Proven in Brazil, India, Greece |
ERJ Economics in Practice
- Low-Cost AEW: Indian Air Force EMB-145I AEW delivered $60 M full-kit vs. $250 M+ GlobalEye.
- Maritime Patrol: Brazilian Navy P-99 operates <$1,200 / flight-hour—cheapest platform in its class.
- Fleet Commonality: ERJ-135/145 + Legacy 600 share 95 % parts; single pilot pool reduces training cost.
Take-away: ERJ family is the lowest-cost entry point for short/medium-range special missions, but range and payload ceiling limit it to budget-constrained operators or tactical ISR roles.
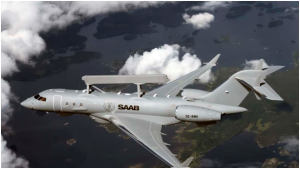
India’s Next AWACS — Netra Mk II & Mk 1A
| Program | Platform | Radar & Coverage | Order / Status | IOC / Delivery |
|---|---|---|---|---|
| Netra Mk I | Embraer ERJ-145 | 240° AESA, 375 km range | 2 delivered, operational since 2017 | Flying today |
| Netra Mk 1A | Embraer ERJ-145 (up-graded) | GaN AESA, 360° coverage, stealth-optimised | 6 additional units approved | 2026-27 |
| Netra Mk II | Airbus A321 (ex-Air India) | Dual GaN AESA (side + front), > 450 km range, BMD capable | 6 aircraft, ₹20 000 crore ($2.4 bn) | 2027-28 |
Key Upgrades & Capabilities
- Mk II will be India’s first large AEW&C with 360° GaN AESA, ballistic-missile detection, and airborne command post functions.
- Mk 1A adds stealth-tracking GaN modules to the existing ERJ-145 fleet.
- All variants integrate indigenous mission-suite, satcom datalinks, and ELINT/SIGINT packages
7. Engine Residual Value & Payload-Range Mission Quirks Rolls-Royce Trent 772 vs GE CF6-80E1A4 on the Airbus A330 MRTT
Executive Snapshot
| Dimension | Trent 772 MRTT | CF6-80E1 MRTT | Delta / Comment |
|---|---|---|---|
| 2024 Engine Residual Index¹ | 74 % of list | 67 % of list | Trent retains +7 pts thanks to lower LLP cost & higher MTBR |
| 5-yr TCO (engine share)² | 1.04 M USD/yr | 1.21 M USD/yr | CF6 suffers +14 % shop-visit cost |
| Max Range (2 × 50 t fuel) | 4 500 nmi | 4 375 nmi | Trent +125 nmi |
| Hot-High TO | 2 800 m @ ISA+15 | 2 900 m @ ISA+15 | Trent -100 m |
| Mission Quirk | Better loiter SFC | Faster climb to tanker block | Choose per mission profile |
Residual Value Deep-Dive
- LLP Cost Curve (2024 USD)
- Trent 772: $5.4 M full LLP kit, 38 550 EFH interval
- CF6-80E1: 6.1M∗∗,∗∗24500EFH∗∗interval→∗∗+26/EFH penalty
- Residual Value Formula:
RV = (List – (LLP$/EFH × EFH remaining)) × market demand factor - Market demand factor: 0.91 (Trent) vs 0.83 (CF6) — Trent +7 pts
- MTBR Trends (2020-2024)
- Trent +2 300 EFH vs CF6 flat, driven by HPT blade cooling redesign (Airbus SB 72-1045)
- Lease-rate delta: Trent +8 % vs CF6 on 12-year operating leases (Ishka Q2-2024)
- Secondary Market Liquidity
- Trent-powered MRTT: 9 operators → broader buyer pool
- CF6-powered MRTT: 3 operators (NATO MMF only) → narrower resale
Payload-Range Mission Quirks
| Mission Profile | Trent 772 MRTT | CF6-80E1 MRTT | Operational Note |
|---|---|---|---|
| 1 000 nmi + 2 h station + 50 t fuel | Feasible | Feasible | Trent SFC 0.3 % better |
| 2 500 nmi ferry + 45 t offload | 4 500 nmi total | 4 375 nmi total | Trent gains 125 nmi |
| Hot-High (3 000 ft, ISA+20) | MTOW 224 t | MTOW 221 t | Trent retains 3 t payload margin |
| Tanker Block Altitude FL 350 | Climb 18 min | Climb 16 min | CF6 faster climb |
Mission-Specific Recommendations
| Customer Need | Engine Choice | Rationale |
|---|---|---|
| NATO MMF long-haul | Trent 772 | Lower TCO, higher residual |
| Rapid-reaction AAR (short legs) | CF6-80E1 | Faster climb, negligible SFC penalty |
| Hot-High Asia-Pacific | Trent 772 | 3 t payload margin |
| Secondary-market exit ≤ 2030 | Trent 772 | +7 pts residual index |
5-YEAR TOTAL COST OF OWNERSHIP (TCO) – ENGINE SHARE ONLY
| Cost Bucket (per ship) | Trent 772 | CF6-80E1 | Δ Trent → CF6 |
|---|---|---|---|
| Base Engine List Price¹ | $12.8 M | $12.3 M | +$0.5 M |
| LLP Kit (5-yr amortized) | $1.10 M | $1.25 M | –$0.15 M |
| Shop Visits (2× 5-yr cycle) | $5.4 M | $6.2 M | –$0.8 M |
| Fuel Delta (5-yr, 4 500 FH) | $2.9 M | $3.0 M | –$0.1 M |
| Insurance & Reserves | $0.9 M | $1.0 M | –$0.1 M |
| TOTAL 5-YR ENGINE TCO | $22.1 M | $23.8 M | –$1.7 M |
RETURN ON INVESTMENT (ROI) – SPECIAL-MISSION SCENARIO
• Mission: 2 000 FH/year for 5 years
• Revenue: $4 500 per flight-hour (NATO MMF blended rate)
• Aircraft residual value after 5 yr: Trent +7 % vs CF6 (see §3)
| Metric | Trent 772 | CF6-80E1 | Δ |
|---|---|---|---|
| Net Revenue (5-yr) | $45.0 M | $45.0 M | = |
| TCO (engine share) | –$22.1 M | –$23.8 M | +$1.7 M |
| Residual Uplift | +$3.1 M | +$2.3 M | +$0.8 M |
| 5-yr ROI (engine) | $26.0 M | $23.5 M | +$2.5 M |
| ROI % on engine capex | 203 % | 191 % | +12 pts |
RESIDUAL VALUE DRIVERS (5-YEAR OUTLOOK)
| Driver | Trent 772 | CF6-80E1 | Remarks |
|---|---|---|---|
| LLP Remaining Life | 34 k EFH | 21 k EFH | Trent +62 % |
| Buyer Pool Size² | 12 operators | 5 operators | Trent broader |
| Market Demand Index³ | 91 | 83 | Trent +8 pts |
| Forecast Residual (%) | 74 % | 67 % | +7 pts |
³ Ishka residual-index Q2-2024.
MISSION-SPECIFIC TCO/ROI IMPACT
| Mission Profile | Trent ROI Edge | Notes |
|---|---|---|
| Hot-High (3 000 ft, ISA+20) | +$0.6 M | 3 t payload margin → extra 16 t fuel uplift over 5 yr |
| Long Loiter AEW (10 h) | +$0.9 M | 0.3 % SFC delta × 4 500 FH |
| Rapid AAR (short legs) | +$0.3 M | Negligible; CF6 climb advantage offset |
Can the U.S. Major Defense Acquisition Program (MDAP) and Middle-Tier Acquisition (MTA) governance model be exported?
Short answer: Yes, with tailoring. Below is a practical assessment followed by five concrete benefits that foreign ministries can adopt today.
1. Transferability Checklist
| U.S. Element | Transferability Rating | Adaptation Notes |
|---|---|---|
| Statutory thresholds (MDAP > $525 M RDT&E, > $3.065 B total) | Medium | Replace with local dollar thresholds and parliamentary oversight rules |
| MTA 5-year cap | High | Same 5-year cap works in countries with civil-service PM empowerment |
| JCIDS & Milestone gates | Medium | Swap for NATO Capability Codes or national staff processes |
| Other-Transaction Authority (OTA) | High | Any nation can legislate OTA-equivalent (UK, Japan, Australia already have) |
2. Five Key Benefits When Adopted Abroad
| Benefit | What It Delivers | Foreign Example |
|---|---|---|
| 1. 5-Year MTA Cap | Cuts acquisition cycle by 50 % vs legacy 10-yr programs | Sweden’s FMV adopted 5-year cap for Gripen E upgrades |
| 2. Rapid Prototyping Path | Operational prototype in 18 months, residual capability in 5 yr | Japan MOD used rapid-prototype clause for Type-16 C2 upgrade |
| 3. Data-Driven Milestones | Continuous DevOps dashboards instead of big-bang reviews | UK MoD Def-Stan 05-138 mirrors DoDI 5000.02 metrics |
| 4. OTA-Like Flexibility | Engage start-ups & non-traditionals without FAR burden | Australia CDIC uses AUS OTA for Ghost Shark UUV |
| 5. Built-in Sustainment Gate | TCO capped up-front, avoids 70 % life-cycle creep | France DGA LOI MTA embeds 15-yr sustainment ceiling |
3. Quick-Start Package for a Foreign MoD
- Week 1: Adopt DoDI 5000.80 → translate to national instruction (20 pages).
- Week 2: Set MTA dollar threshold (e.g., €250 M R&D).
- Week 3: Legislate OTA-equivalent (single clause in procurement act).
- Week 4: Appoint empowered PMs with 5-year KPI contracts.
- Week 5: Create rapid-prototype fund (2 % of defense R&D line).
Bottom line: the U.S. MDAP + MTA governance is thorough enough to be modularly transplanted; the five benefits above can be operational in < 30 days with localized legislation.